Market Update Preview
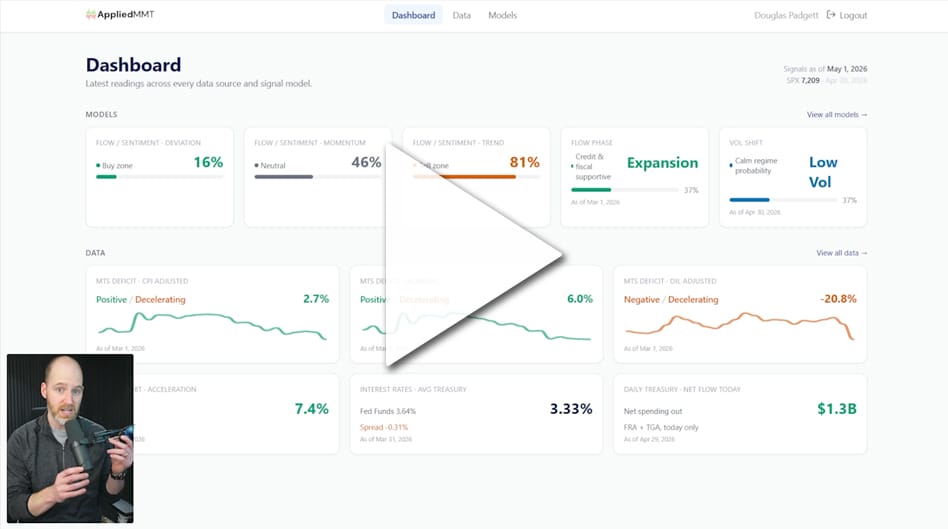
The new AppliedMMT dashboard is live this week — head to the beta dashboard link on the site to check it out. All the daily Treasury data, the flow phase model, vol shift, flow sentiment, and a handful of new model upgrades are now in one cleaned-up spot. I'll walk through what changed and how to use it.
On markets: April was a heck of a run, and we're now showing classic signs of technical exhaustion, we may need a pause here but I'm not convinced, with some caveats, that a big selloff is needed.
But here's the bigger story. While building out the dashboard, I came across a margin debt chart that genuinely jumped off the page. We're now seeing a divergence between price returns and margin debt growth that has only shown up at two other points in the last 50 years — and both times it preceded a major recession. Combined with what the deficit impulse is telling us about late 2026, the picture is getting clearer about where we are in this cycle. We're at least in the seventh-inning stretch.
Full breakdown below — including why I think the next leg higher is still on the table, and what the actual end-of-cycle trigger I'm watching for looks like.
(Note: Below is a summary of the Market Update Video for 05/02/2026, click here to watch the video update)