
This past June, we experienced a rare event: the U.S. federal government ran a surprise budget surplus (no, you will not read this anywhere in mainstream press or financial news). The $77 billion monthly surplus compares to a $163 billion deficit in June 2023, a $240 billion swing. As a reminder, when the government runs a surplus, it reduces the net financial savings of the U.S. private sector, and vice versa when it runs a deficit.
This big swing brought the total U.S. budget into a $13 billion surplus for the quarter versus a $178 billion deficit in 2023 over the same period.
Some additional datapoints can provide meaningful context. Below shows the trailing 12-month cumulative deficit going back to the end of 2022:
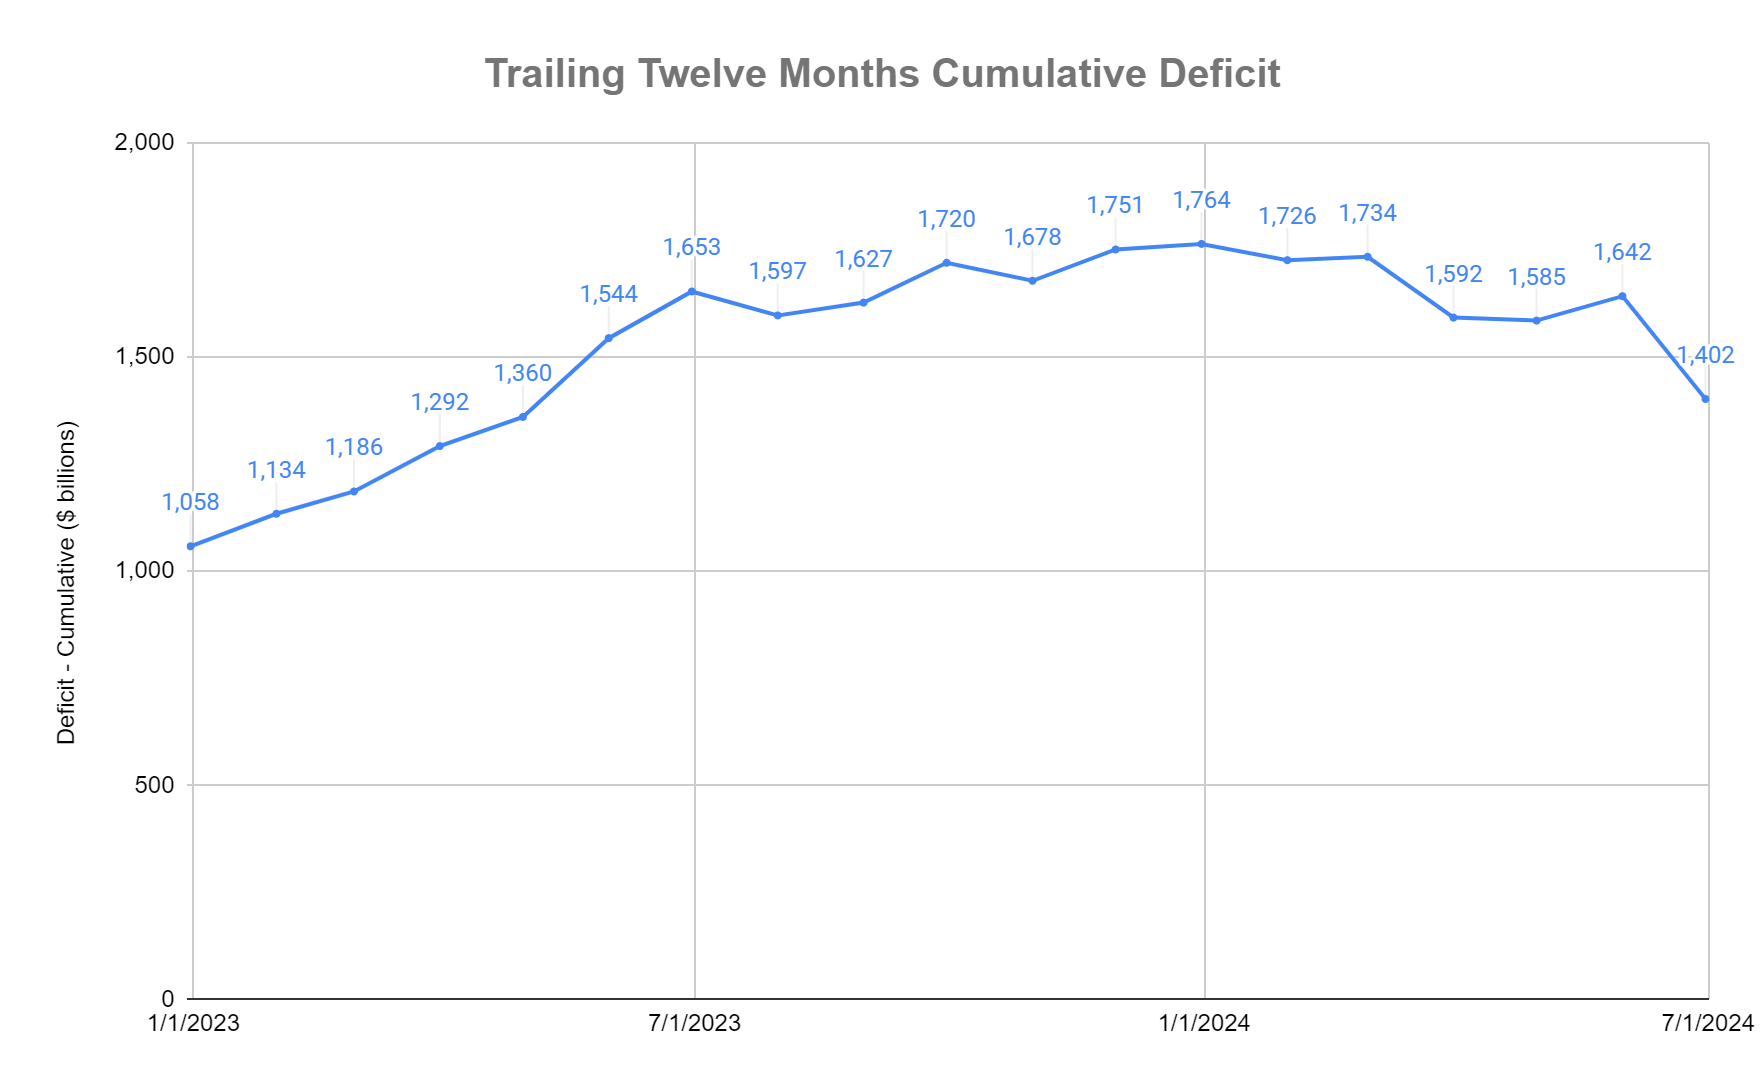
The trailing twelve month cumulative deficit has dropped $362 billion (20.5%) year-to-date and $251 billion (15.2%) year-on-year.
On an average monthly basis, the data looks like this:
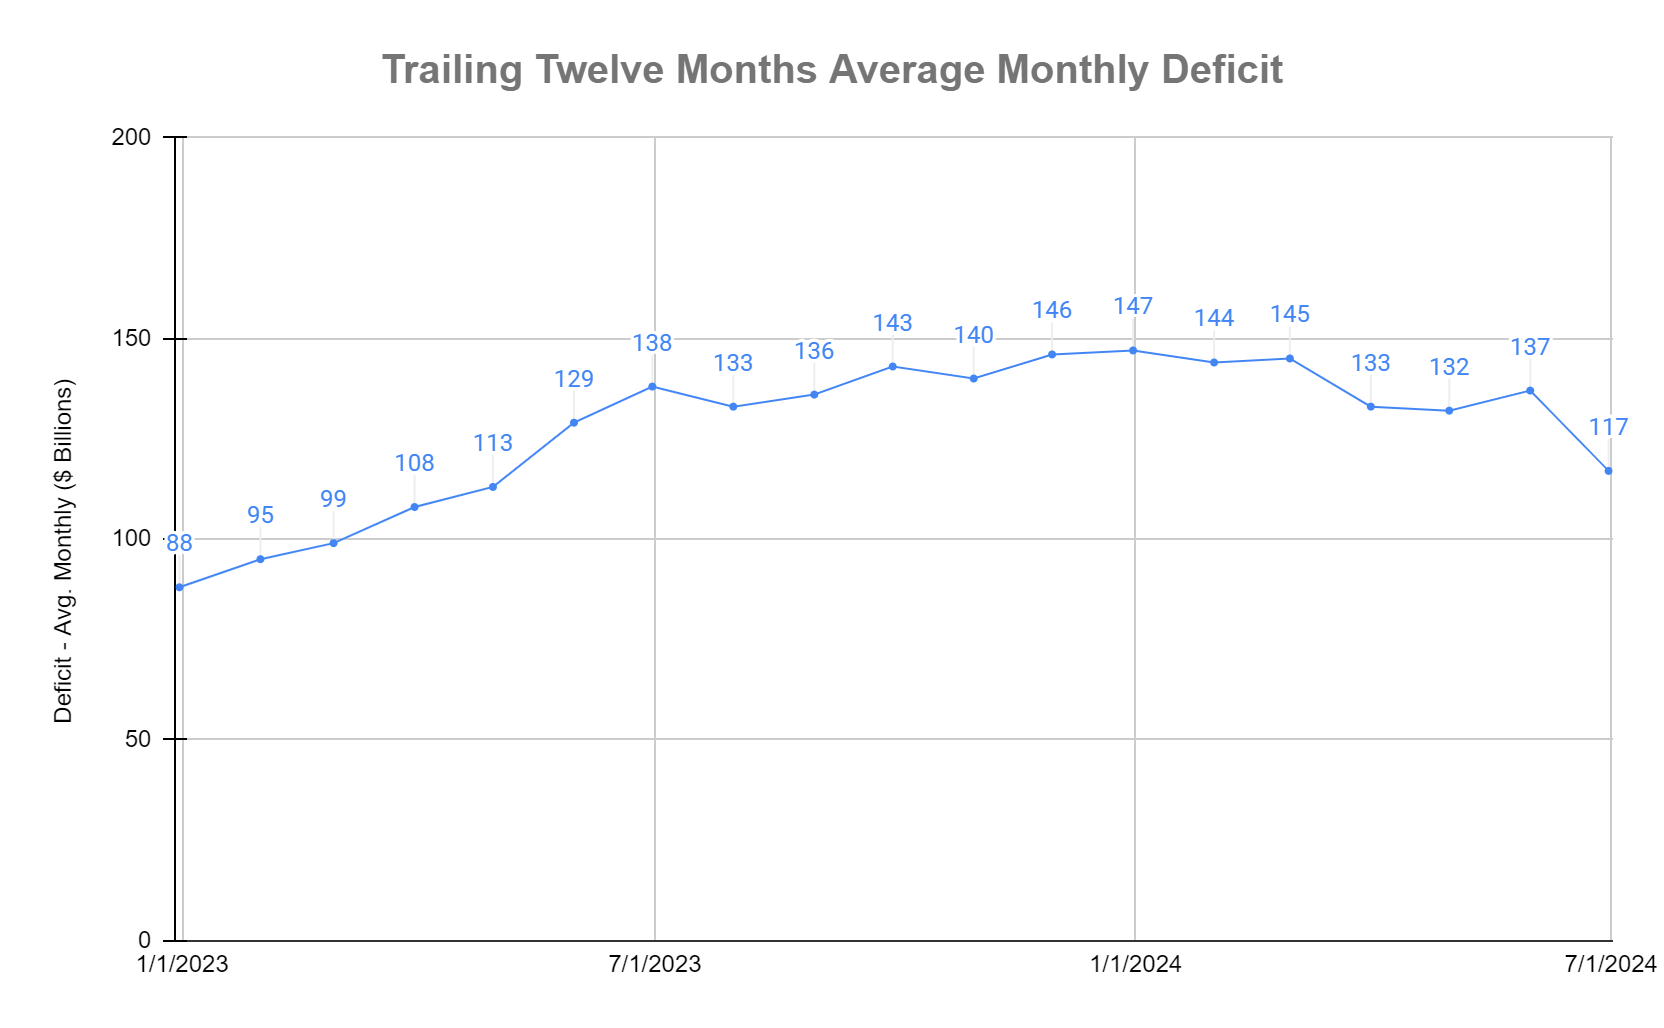
Importantly, the $88 billion trailing twelve month average monthly deficit at the end of 2022 reflects a year that was back-end loaded: the average in the first half of 2022 was $40 billion per month, and accelerated $137 billion per month in the second half. Recall that in the first half of 2022, the U.S. recorded two straight quarters of negative GDP growth amidst the fiscal tightening and a spike in energy and related commodity prices following Russia's invasion of Ukraine.
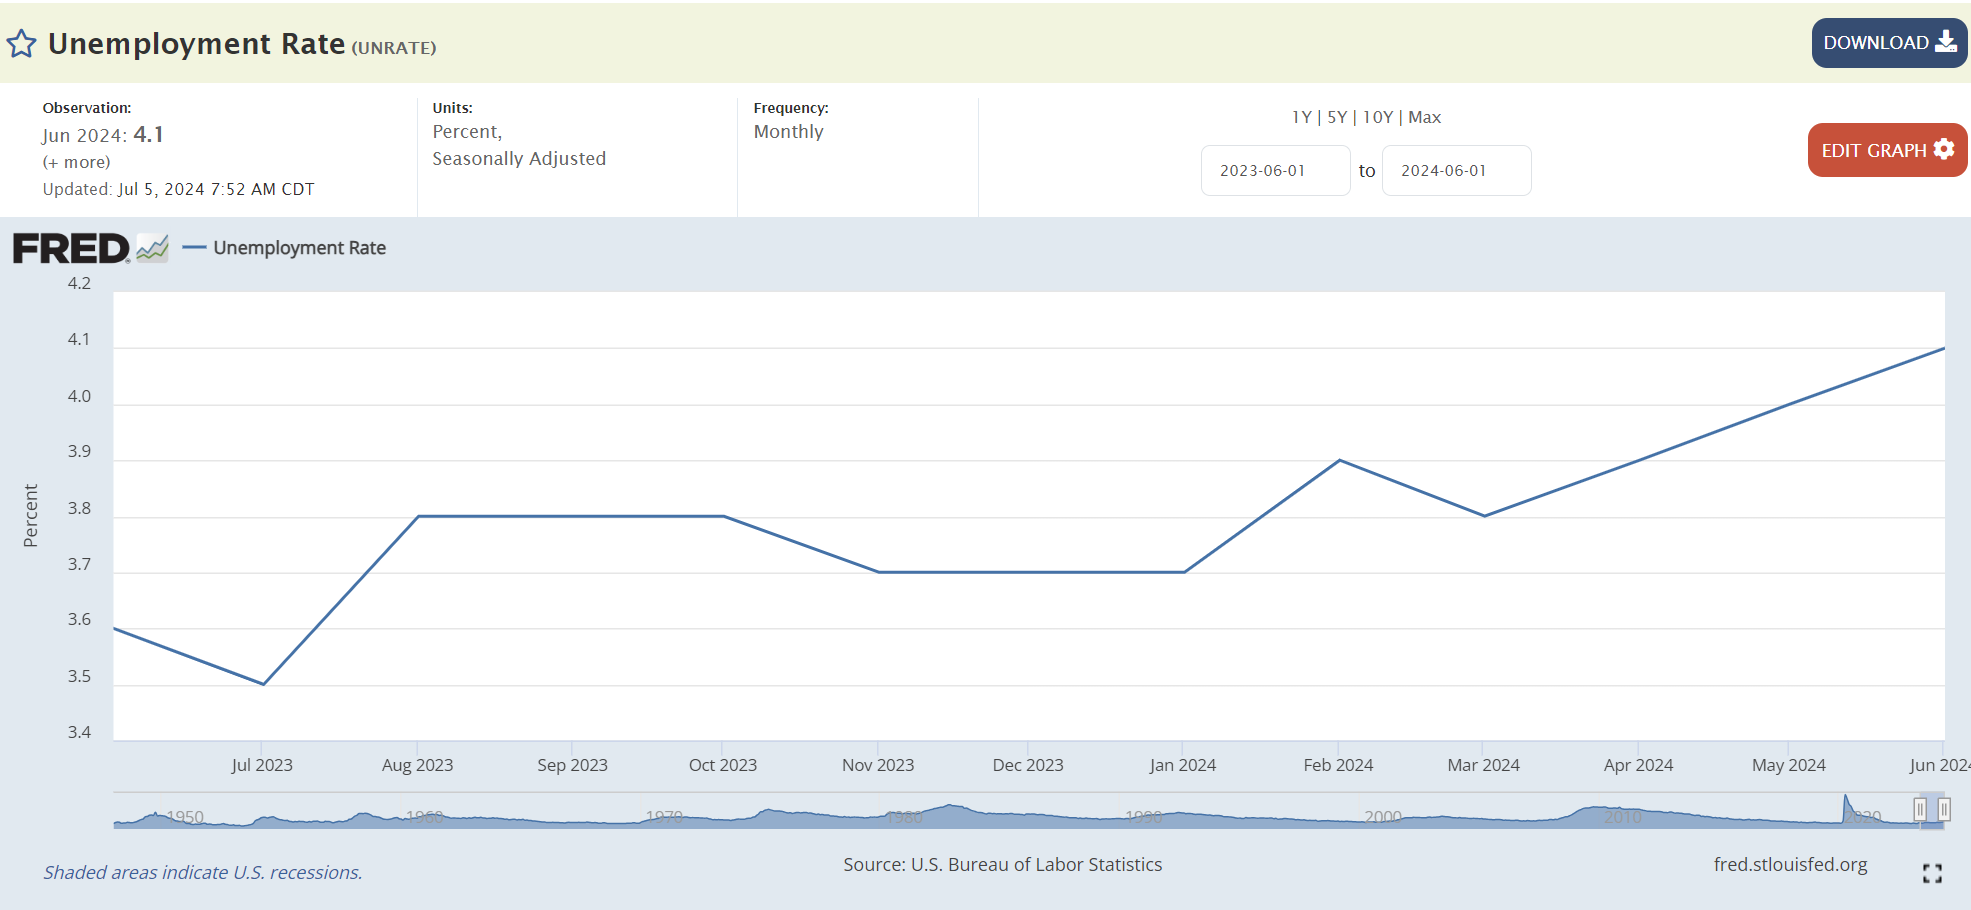
Unsurprising to those familiar with the MMT framework for analysis, the recent decline in the deficit has coincided with softening economic data. Over the last year, unemployment has moved up from 3.6% to 4.1%, with most of that move coming in the first half of 2024:
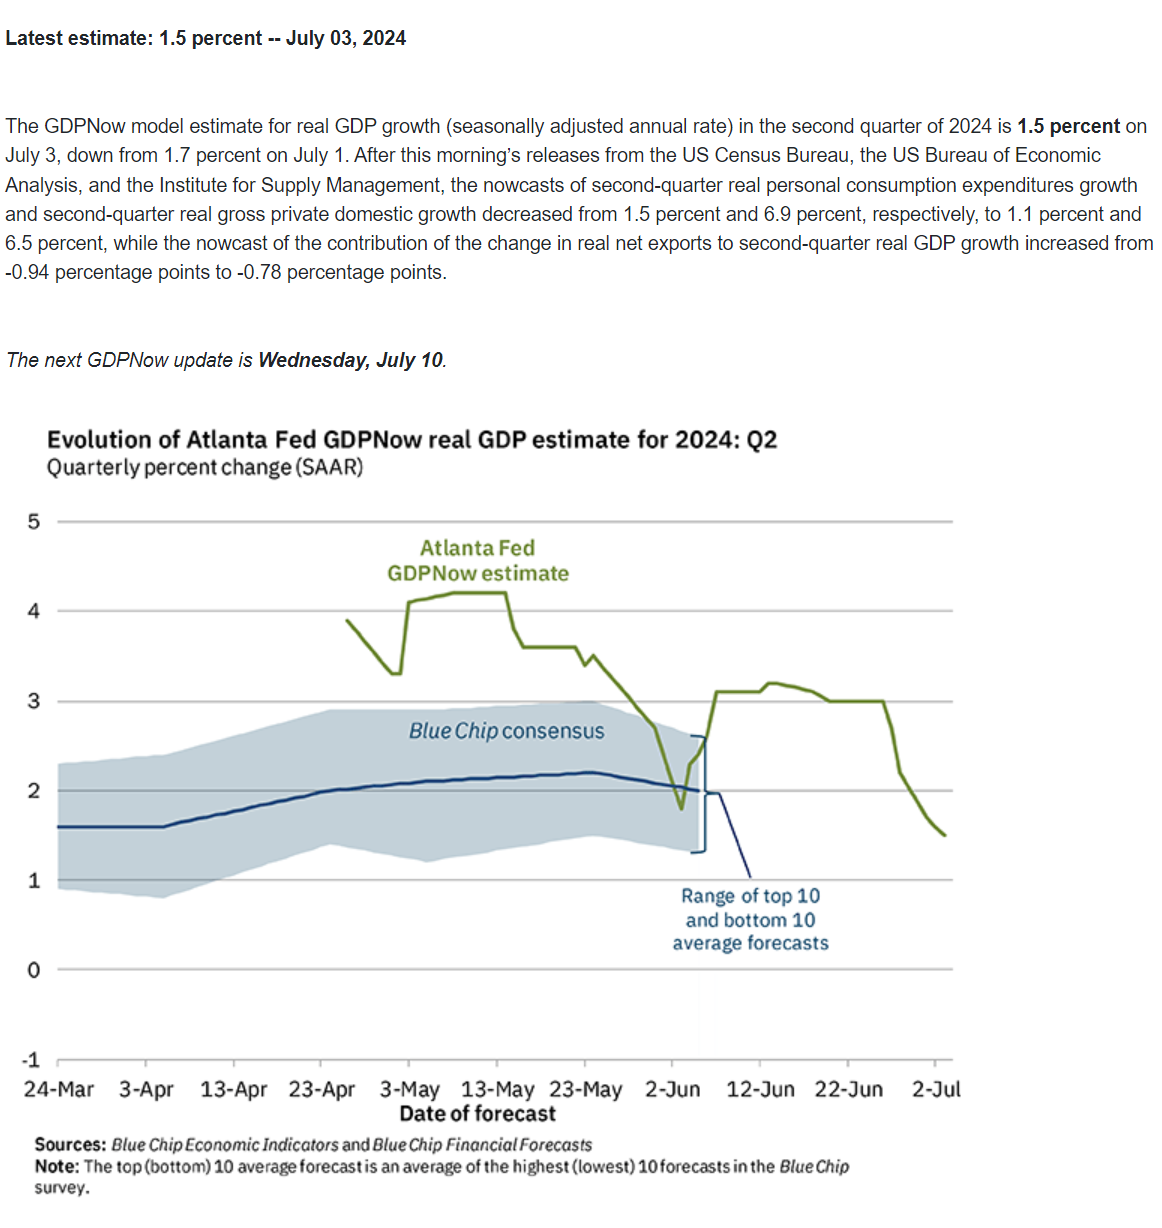
And GDP growth slowed to 1.4% in the first quarter of 2024:
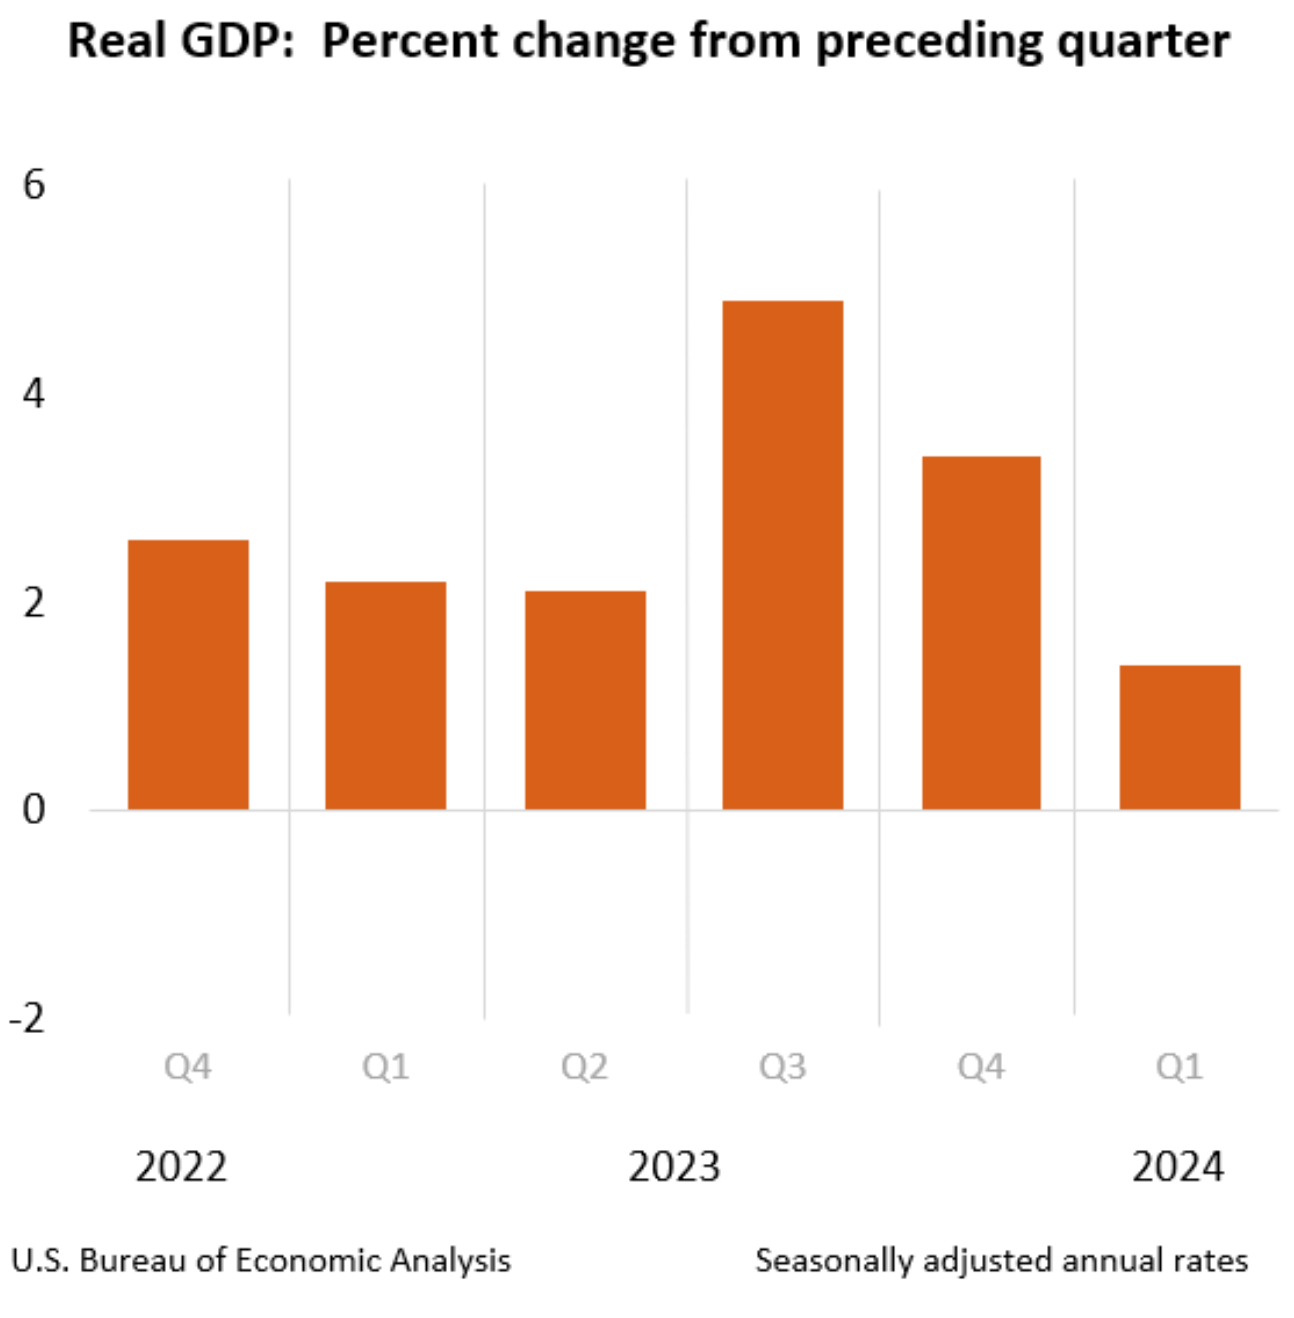
With the Atlanta Fed's GDPNow models indicating similar results for the second quarter:
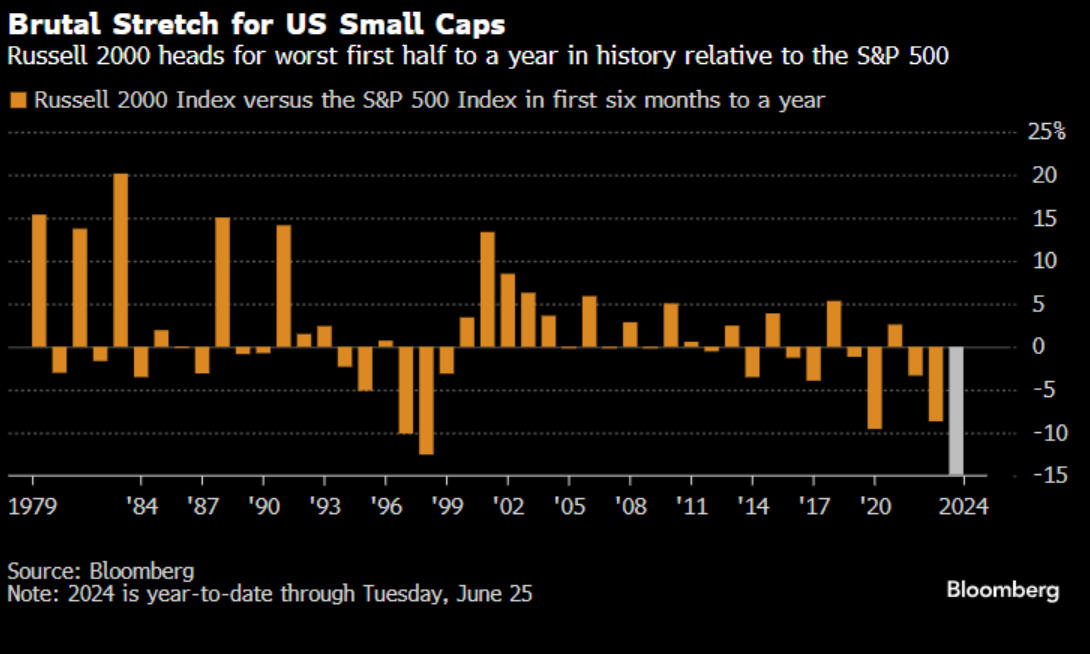
And the effects of this have been felt in the financial markets as well. While headline index returns have been overwhelmingly positive (the S&P 500 has made 31 new all-time highs this year), the returns have been heavily skewed towards the largest capitalization stocks. In fact, as Bloomberg reporter Jess Menton pointed out the other day, the first half of 2024 saw the largest outperformance of the S&P 500 versus the Russell 2000 on record:
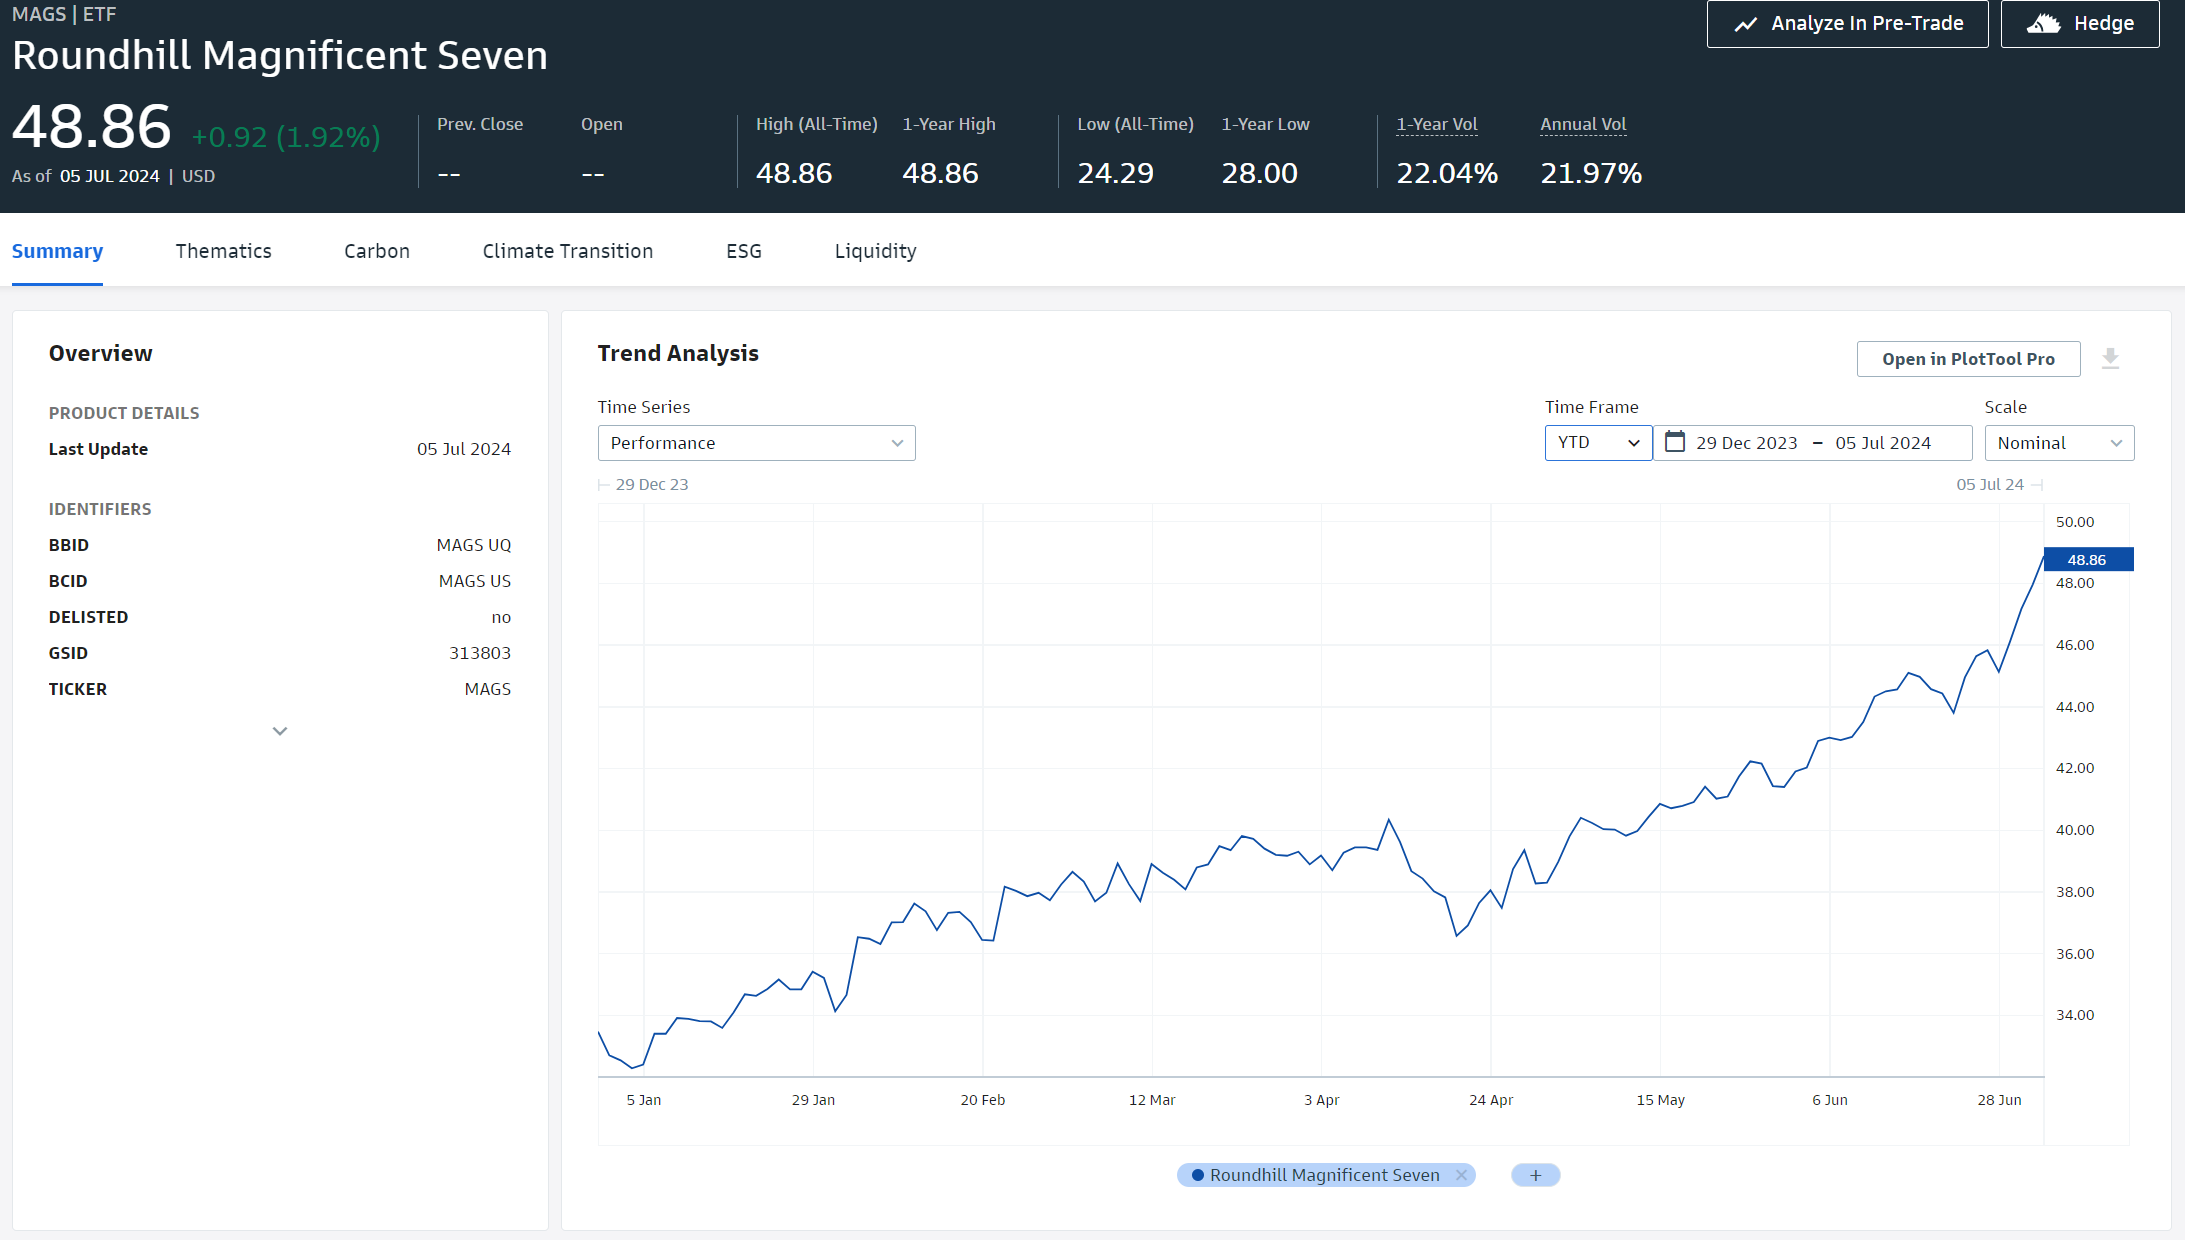
And the dispersion between large caps (S&P 500) and small caps (Russell 2000) belies the skew within the S&P 500 index itself. The so-called "Magnificent 7" (Alphabet, Amazon, Apple, Meta, Microsoft, Nvidia, and Tesla) have contributed an overwhelming majority of the S&P 500's gains year-to-date. Below is a return summary for the Roundhill Magnificent Seven ETF ($MAGS), an ETF which only holds those seven stocks:
Meanwhile, the Russell 2000 and Dow Jones Industrial Index, which are more closely linked to the U.S. economy, returned a mere +1.7% and +4.8% respectively in the first half. Notably, these indices returned -1.3% and -3.3% in the second quarter, coinciding with the U.S. federal budget surplus. Looking at Credit, the ICE BofA US High Yield Index returned 2.6% year-to-date and 1.1% in the second quarter, while the ICE BofA US Distressed High Yield Index (which includes the junkiest of junk bonds) returned -2.1% and -2.7% respectively.
These results are consistent with what we've observed historically, which is that a shrinking deficit leads to outperformance by larger, higher-quality stocks with strong balance sheets that generate consistent, durable earnings relative to smaller, riskier stocks and credits with weaker balance sheets and lumpier earnings (the opposite tends to be true when deficits are rising).
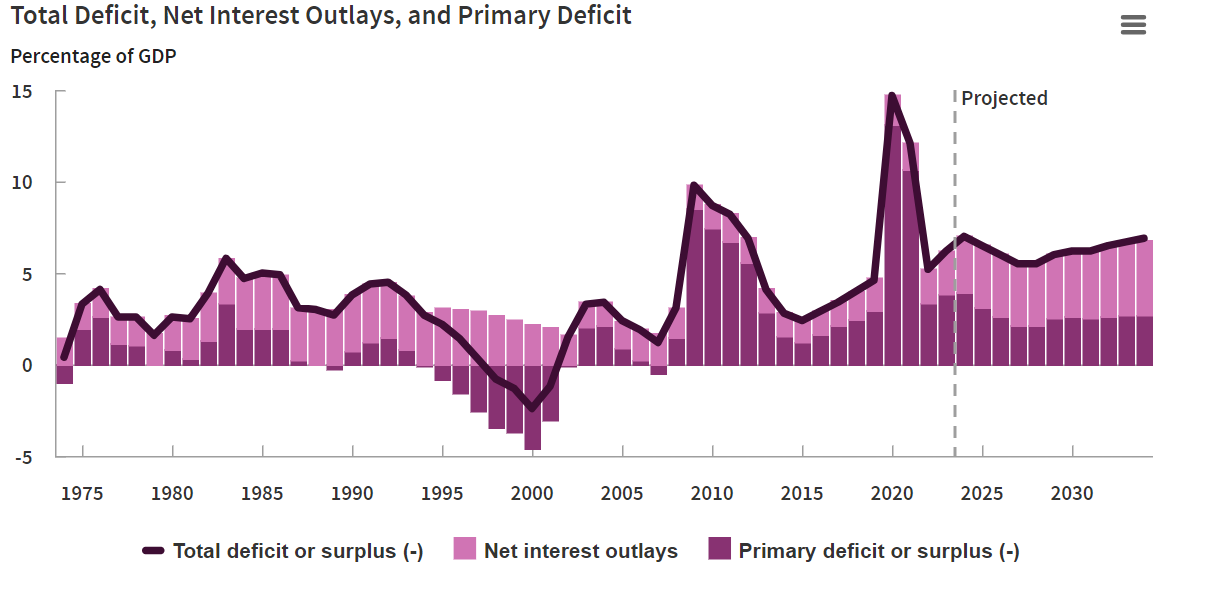
Looking ahead, there's reason to believe this trend will reverse. Through the first half of 2024, the U.S. federal government ran a $470 billion deficit ($78 billion per month), down substantially from the first half of 2023 ($833 billion or $139 billion per month). And yet, the CBO recently released projections that FY2024 will see a $1.9 trillion deficit. According to our math, the deficit through the first nine months of fiscal year 2024 (which began October 1, 2023) is $882 billion. Given that the fiscal year ends September 30, the CBO's assumptions imply around a $1 trillion deficit (or about $333 billion per month) over the next three months - a meaningful pickup. By comparison, in the same period 2023 the U.S. ran a $519 billion deficit ($173 billion per month). As the CBO notes, A $2 trillion deficit is approximately 7% of 2024 estimated GDP and 6.5% of 2025 GDP estimates, which are "significantly more than the 3.7 percent that deficits have averaged over the past 50 years." Below indicates historical and projected deficits as a percent of GDP through 2034:
If these estimates are even directionally correct, they support the case for the U.S. economic expansion to continue and for investors to maintain a healthy allocation to U.S. equities.